The battery is the power source of electric vehicles and one of the core
technologies of electric vehicles. Using modern testing methods to study the
performance of lithium-ion batteries is an important way to reduce battery costs
and increase cruising range.
The battery is the power source of electric vehicles and one of the core
technologies of electric vehicles. Using modern testing methods to study the
performance of lithium-ion batteries is an important way to reduce battery costs
and increase cruising range.
Electrochemical impedance spectroscopy is widely used in the analysis of
positive and negative electrode materials of lithium-ion batteries, research on
lithium-ion deintercalation kinetic parameters, solid electrolytes, interface
reactions, and SOC prediction. It is a powerful tool for analyzing the
performance of lithium-ion batteries. This article synthesizes the results of
electrochemical impedance spectroscopy in studying the performance of
lithium-ion batteries, and looks forward to the application progress and
development direction of electrochemical impedance spectroscopy.
1 Introduction to electrochemical impedance spectroscopy
Electrochemical impedance spectroscopy (EIS) is a non-destructive method
for parameter determination and effective battery kinetic behavior
determination. A sine wave voltage signal with a small amplitude of frequency w1
is applied to the battery system, and the system generates a sine wave current
response with frequency w2. The change in the ratio of the excitation voltage
and the response current is the impedance spectrum of the electrochemical
system.
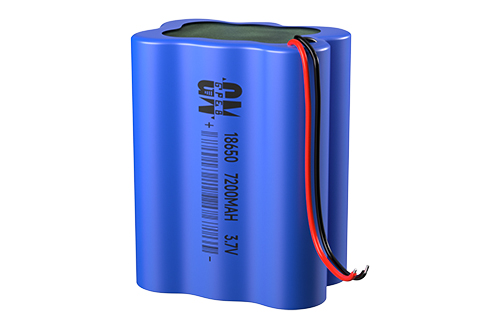
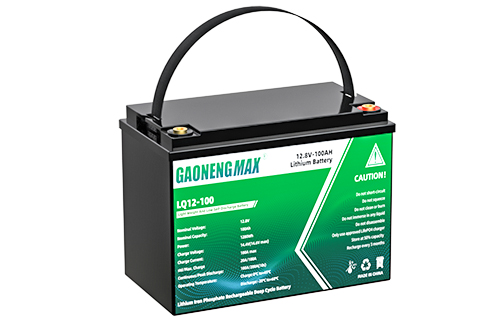
Low temperature lithium iron phosphate battery 3.2V 20A -20℃ charging, -40℃
3C discharge capacity ≥70%
Charging temperature: -20~45℃ -Discharge temperature: -40~+55℃ -40℃ Support
maximum discharge rate: 3C -40℃ 3C discharge capacity retention rate ≥70%
Click for details
EIS has high practicability. This testing method can scan from very low
frequency (several μHz) to very high frequency (several MHz) to realize
electrochemical interface reaction research in a wide frequency range. At
present, most domestic research is still in the initial exploration stage, and
most of them focus on EIS curve analysis and related electrochemical
interpretation. Foreign research has made breakthroughs in the establishment of
EIS mathematical models and practical applications of EIS (such as battery
temperature prediction based on EIS).
The first part is the ultra-high frequency part, the part where the
impedance curve intersects with the horizontal axis: ohmic impedance Rb;
The second part is the high-frequency part, semicircle: lithium ions pass
through the solid electrolyte impedance Rsei;
The third part is the intermediate frequency part, semicircle: charge
transfer impedance, also called electrode polarization impedance Rct;
The fourth part is the low-frequency part, 45° straight line: lithium ion
diffusion impedance, also called concentration polarization impedance W.
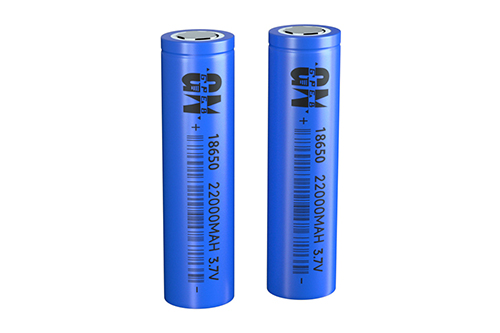
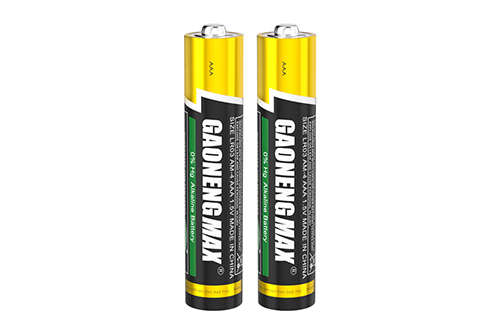
Low temperature and high energy density 18650 3350mAh-40℃ 0.5C discharge
capacity ≥60%
Charging temperature: 0~45℃ Discharge temperature: -40~+55℃ Specific
energy: 240Wh/kg -40℃ Discharge capacity retention rate: 0.5C Discharge capacity
≥ 60%
Click for details
2 Introduction to Equivalent Circuit Model
A lithium-ion battery can be understood as a circuit system including
resistance, inductance and capacitance. The establishment of an equivalent model
is to simplify the battery into a circuit system to simulate the change process
in the electrochemical system.
Corresponding to the impedance components of each frequency in the
impedance spectrum, Rb represents the ohmic resistance; Rsei and Csei represent
the resistance and capacitance of the SEI film, corresponding to the semicircle
in the high-frequency part; Rct and Cdl represent the charge transfer resistance
and electric double-layer capacitance respectively, and The intermediate
frequency part corresponds to the semicircle; W is the Warburg impedance, that
is, the diffusion impedance of lithium ions in the electrode material, which is
represented by a straight line at 45° to the real axis on the complex plane.
3 Current research status at home and abroad
At present, research on electrochemical impedance spectroscopy mainly
focuses on the prediction of SOC, analysis of electrode materials, lithium ion
deintercalation process and research on solid electrolyte membranes. A large
amount of research has been devoted to exploring the relationship between ohmic
impedance, charge transfer impedance, diffusion impedance and SOC, SOH,
temperature, charge and discharge rate, and providing relevant electrochemical
explanations.
The establishment of the equivalent circuit model relies on the curve form
of the electrochemical impedance spectrum. Some scholars have proposed pure
mathematical models to replace the equivalent circuit model, providing multiple
solutions for data fitting. Comprehensive related research shows that ohmic
resistance is slightly affected by SOC, temperature, rate and other factors,
while charge transfer resistance and lithium ion diffusion resistance are
significantly affected by these factors.
4Research progress
4.1The impact of SOC
SOC is the battery state of charge and also reflects the battery power
usage status. The impedance curve fitted by EIS can be used to determine the
changes in impedance inside the battery. At the same time, EIS can also provide
a basis for selecting the optimal SOC range for the battery.
Xi Jingjing et al. studied the changes in impedance of lithium iron
phosphate batteries with SOC, focusing on the mid-frequency impedance. She found
that the ohmic impedance remained unchanged at different SOCs, and the charge
transfer impedance and diffusion impedance were significantly affected by SOC.
It also verified the feasibility of using series capacitance, electric double
layer capacitance and charge transfer impedance to predict battery SOC.
Zhang Wenhua et al. used a C/LiFePO4 battery with a capacity of 60Ah as the
research object, and conducted full charge and full discharge experiments on
four groups of batteries with different cycle times at a charge and discharge
rate of 1.0C. The research results were similar to Xi Jinping's research. They
believe that the ohmic impedance is basically unchanged under different SOC
states. The charge transfer resistance and diffusion resistance showed a trend
of first decreasing, then stabilizing and then increasing. They were
significantly larger in the SOC range of 0-25% and 75%-100%, and tended to be
flat in the middle range. They believe that this is caused by the weak electrode
response between low SOC and high SOC.
Jiang Jiuchun and others tested the impedance spectrum of lithium iron
phosphate batteries under different SOC. Compared with the research by Zhang
Wenhua et al., the impedance spectrum curve obtained by Jiang Jiuchun et al. can
distinguish charge transfer impedance and diffusion impedance with high
precision, which well confirms the electrode polarization and electrochemical
characteristics caused by lithium ion concentration and electrochemical
properties of electrode materials. Significant changes in concentration
polarization. Analysis of charge transfer impedance characteristics at 10%, 50%
and 90% SOC based on the Arrhenius equation provides a theoretical basis and
estimation method for the selection of SOC usage intervals for battery energy
management strategies.
Yuan Xiang et al. conducted experimental studies on the impedance
characteristics of power lithium-ion batteries under charging and discharging
conditions. Coinciding with the research of Zhang Wenhua et al., the ohmic
impedance they measured almost did not change with SOC, but the charge transfer
impedance was very different during charging and discharging. As the charging
depth increases, the charge transfer impedance decreases, and the change is most
obvious in the 0.1-0.2 SOC range, as shown in Figure 3. During discharge, the
consumption of electrolyte active material causes the charge transfer resistance
to increase, which rises sharply at low SOC. For the diffusion impedance, the
change pattern of the charging process and the discharging process is that the
values in the high SOC interval and the low SOC interval are small, and the
value in the middle SOC interval is relatively large. However, when the
discharge reaches below 10% SOC, the diffusion coefficient decreases rapidly, as
shown in Figure 4. The diffusion resistance is inversely proportional to the
diffusion coefficient, so the diffusion resistance increases significantly.
4.2 Effect of temperature
In lithium-ion batteries, almost all diffusion processes are affected by
temperature. The self-heating during the battery charging and discharging
process and the ambient temperature all affect the transfer of charge inside the
battery and the deintercalation of lithium ions in the electrode active
material.
Xie Yuanyuan et al. conducted an experimental study on the thermal impact
of battery impedance spectrum and tested the battery impedance spectrum under
different cycle times. In the first cycle, temperature has little impact on mid-
and high-frequency impedance, but has a large impact on low-frequency impedance.
Under high temperature conditions, the low-frequency impedance changes very
little, and the mid-frequency impedance changes greatly. This is because the SEI
is destroyed and reacts with the electrolyte to generate new SEI, causing
oscillations in the impedance spectrum.
Jiang Jiuchun et al. studied the impedance spectrum under temperature
conditions of 263~318K. Research shows that as the temperature increases, the
electrochemical polarization resistance decreases, and the curve is almost
oblique at 318K, making it difficult to distinguish the various impedance
components, as shown in Figure 5.
Considering the effects of SOC and temperature comprehensively, it can be
concluded that under low temperature conditions, the activity of the electrolyte
inside the battery is low and the polarization is serious. At high temperatures,
the high activity of the reactants reduces the interface resistance and charge
transfer resistance, and is accompanied by battery side reactions—interface
degradation. Their research can be used for battery management systems to select
a reasonable temperature range (for example, 5 to 45°C). The impedance at other
temperatures can be estimated based on impedance data at a certain temperature,
and a reasonable temperature range control strategy can also be formed.
If the internal impedance of the battery is too large, it may cause
abnormal temperature rise of the battery during high current discharge, causing
the battery to become thermally out of control. In order to ensure the thermal
safety of the battery, battery temperature prediction and estimation is
particularly important. J.G. Zhu et al. used electrochemical impedance
spectroscopy to predict battery internal temperature. Impedance spectroscopy is
used to explore the excitation frequency range that can be used for battery
internal temperature estimation. Since SOC is difficult to estimate, it was
found that SOC characteristics such as low frequency and high frequency are not
friendly. However, the impedance spectrum with only temperature changes allowed
them to find the optimal excitation frequency range and establish a temperature
prediction mathematical model related to the excitation frequency. They
concluded that low frequency is better than high frequency and phase shift is
better than impedance spectrum amplitude in temperature estimation.
H.P.G.J.Beelen et al. proposed a measurement system for estimating battery
temperature based on the set temperature, using calculation formulas containing
parameters such as excitation frequency f, impedance amplitude, etc. to estimate
battery temperature. The temperature estimation method of impedance spectrum is
divided into two steps. One is to determine the excitation frequency that acts
on the experimental set value, and the other is to use the impedance amplitude
to estimate the battery temperature. The combination of experimental design and
parameter estimation allowed the researchers to obtain the most accurate
temperature values.
Regarding the accuracy of temperature estimation, the researchers used the
Monte-Carlo method to study the accuracy of battery temperature estimation and
found that it had an absolute deviation of 0.4°C and a standard deviation of
0.7°C, so the accuracy was good. The researchers' research has a good reference
value for temperature control of battery thermal management systems.
There are many factors that affect impedance. If multiple factors are
considered comprehensively, the impact of different factors on impedance can be
explored. Alexander Farmann et al. studied the kinetic parameters of new and old
batteries at different SOC and different temperatures. They believe that the
sensitivity of the electrolyte to temperature results in high impedance at low
temperatures and low impedance at high temperatures. During the service life of
the battery, the shape of the curves of ohmic impedance and charge transfer
impedance as they change with SOC and temperature remains basically unchanged,
and the effect of temperature on impedance is greater than the effect of SOC on
impedance. They also fit the overall impedance versus SOC and temperature
curves, which can be used for battery voltage prediction in electric
vehicles.
Similarly, DAndre et al. used electrochemical impedance spectroscopy to
explore the effects of temperature and SOC on the performance of high-power
lithium-ion batteries, and considered the low-temperature starting conditions of
electric vehicles, clarifying that the battery design needs to meet certain
low-temperature conditions. Similar to Alexander Farmann's research, it was also
concluded that the internal impedance of the battery is mainly affected by
temperature and is less affected by SOC.
4.3 Influence of charge and discharge rate
Lithium-ion power batteries often encounter working conditions with
different power requirements, and the required charge and discharge currents
vary greatly, which also affects the charge transfer process and electrochemical
reaction process inside the battery.
In order to explore the battery impedance under different charge and
discharge rates, Xie Yuanyuan et al. used lithium-ion batteries as the research
object and tested the impedance spectra under 0.1C, 0.2C and 0.5C charge and
discharge rates. Researchers believe that when charging and discharging with
small current, the battery impedance does not change much under a certain number
of cycles, and the small current has the effect of reducing the low-frequency
impedance of the battery. When charging and discharging with large current, the
semicircle of the intermediate frequency part increases, and the charge transfer
impedance increases. It was also found that although low charge and discharge
rates can greatly reduce the impact of cycling on battery impedance in the
mid-to-high frequency range, its impact on the low-frequency component of the
impedance spectrum is still significant.
Electrochemical impedance spectroscopy is one of the powerful tools for
studying electrochemical reactions at the electrode/electrolyte interface. It is
widely used in research on the impedance of positive and negative electrode
materials and the insertion and extraction of lithium ions in positive and
negative electrode materials. Masayuki Itagaki et al. focused on the charge
transfer resistance and ohmic impedance of battery positive and negative
electrode materials at 0.5C, 1.0C and 1.5C charge and discharge rates. Research
shows that at 1.5C rate, the change in charge transfer impedance of the positive
and negative electrodes shows a certain hysteresis phenomenon, and the
influencing factor is the direction of the current. Regarding ohmic impedance,
whether it is a positive electrode material or a negative electrode material,
the effect of magnification rate on its size and change trend is not obvious. It
can be considered that in the electrodes of lithium-ion batteries, the charge
transfer impedance during the delithiation process is greater than the charge
transfer impedance during the lithium insertion process.
4.4Influence of SOH
SOH is a reflection of the health status of the battery and an indicator of
the aging status of the battery. After a battery has undergone a certain number
of charge and discharge cycles, the decline of the battery will obviously
intensify, mainly manifested in the reduction of discharge voltage and discharge
capacity, which will challenge the performance of the battery.
Zhang Wenhua et al. explored the relationship between the aging state of
lithium iron phosphate batteries and battery impedance, and analyzed in detail
the changes in each impedance component with the number of cycles. It was found
that more than 800 cycles have a great impact on the charge transfer impedance
and have a minimal impact on the ohmic impedance and diffusion impedance. They
believe that SOH is between 95% and 100%, ohmic impedance, charge transfer
impedance and diffusion impedance remain basically stable, and the battery is in
a stable state of charge and discharge. When SOH is reduced below 90%, the
charge transfer resistance and diffusion resistance increase significantly, the
interface structure between the electrolyte and the electrode is gradually
destroyed, and a new arc appears in the low-frequency region of the impedance
spectrum. The reason may be that the battery negative electrode material is
damaged Destroyed, the lithium insertion reaction slows down. Their research
shows the correlation between AC impedance and battery degradation, which can be
used to screen out aging batteries, which is beneficial to the sequential
utilization of lithium-ion batteries.
Based on electrochemical impedance spectroscopy, Zhang Caiping and others
analyzed the aging characteristics of the battery and proposed a way to use
lithium-ion batteries in stages to extend their life. Comparing the impedance
spectrum curves of new and old batteries, it was found that the degradation of
battery performance after use was mainly caused by the increase in
electrochemical polarization resistance and concentration polarization
resistance. A method was proposed to control the degree of polarization by
controlling the charge and discharge rate. The research by Zhang Caiping and
others considers the recycling issue of lithium-ion batteries, which is of great
significance to reducing the full life cycle cost of batteries and promoting the
healthy and green development of the battery industry.
In terms of battery aging life research, Xu Xinmin and others conducted
aging experiments and electrochemical impedance spectroscopy tests on lithium
iron phosphate battery samples using cyclic charge and discharge methods. They
proposed a SOH calculation formula based on AC impedance and verified the
feasibility of testing battery AC impedance with current perturbation
excitation. Based on the obtained impedance data, it was found that the
low-frequency impedance and SOH showed a monotonically increasing pattern.
Finally, a linear fitting method was used to obtain the battery aging curve,
which provided algorithm support and theoretical basis for using impedance data
to calculate SOH and predict battery service life.
Read recommendations:
6F22
Nickel -hydride battery has good environmental protection and recyclable.cabinet type energy storage
Lithium battery conductivity
551521 battery manufacturer
L822 battery


 360° FACTORY VR TOUR
 Whatsapp
 Tel
Tel Email
Email TOP
TOP